
Prior to Friday's report on our StateSide September Slump in payrolls growth, Gold's performance since having achieved "lift-off" (two missives ago) has rather been that of a vehicle from Kim Jong Un's toy box: a rocket which after launch and serpentining upward for a bit, has yet again fizzled to sink mere meters offshore into the Sea of Japan. So similar has been Gold's track these past two weeks, a somewhat awkward post lift-off toppling over to back from whence it came, and then some -- until yesterday. More on that in a moment. But first...
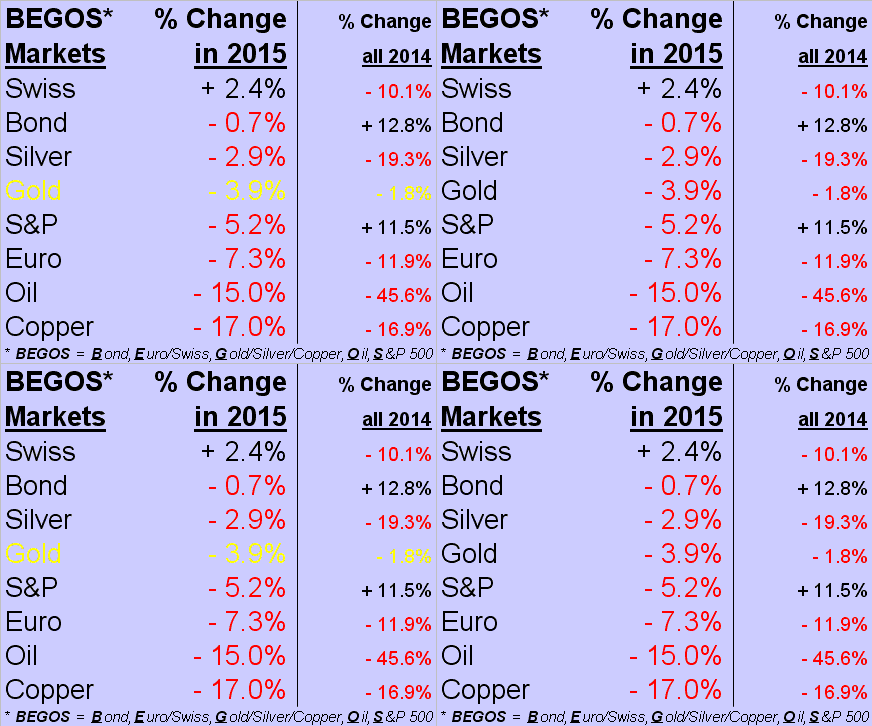
That blur which just passed you was September. 'Twas fast, non? Thus, with not just another month in the books, but indeed another quarter, here are our BEGOS Markets Standings through three quarters of 2015-to-date, plus October's first two trading days. And to see the Swiss franc still topping the performance stack, with the mighty economic engines of Oil and Copper both again (see right-hand column as well) perilously pressured, 'tis quite amazing that Gold is not significantly higher, nor the S&P 500 significantly lower. (Yes, the Doggie Dollar Index is +5.9%, and were it a BEGOS Market, 'twould be leading the pack, but: presently at 96.040, 'twas also at that level back in March, during which month Gold was trading up in the 1200s)...
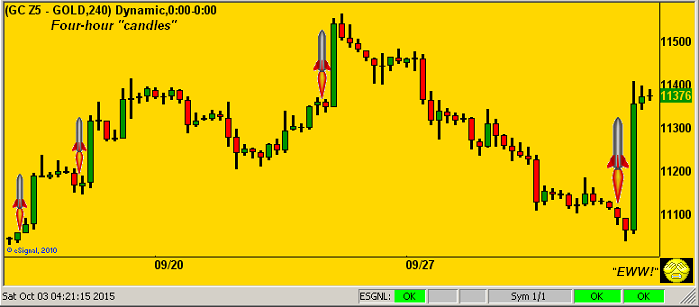
...which begs the case that, today at 1138, Gold ought well be bought to match such Dollar Index equivalent. (But then again, we know that Gold plays no currency favourites, thank goodness). Moreover, we've now clear evidence that there are those who are not sitting on their hands to see who buys first. For with respect to Gold having lifted off again yesterday -- to its second best daily percentage gain of the year (+2.2%) -- we're beginning to see what was a hallmark of the yellow metal's performance through much of this millennium, until 2012, which differentiated Gold from other major markets: its tendency to rise faster than it falls. To be sure, price remains well down and many a trendline study still is negative, depending from where one measures. But when it comes to upside rocket shots, we've not seen a display such as is next depicted in recent memory. Follows is a graphic of Gold, each bar or "candle" being four hours in duration, as charted from mid-September through yesterday's settle. Therein, we've selected four rocket shots. Each one of them is more substantive in buying (green) thrust than are any of the selling (red) thrusts. The upside surges are strong, the downside "chicken weak-hands sellers", on balance, wimpy. And as we saw yesterday, when a week's worth of losses are recovered in what was less than 30 minutes, it may best to cover one's eyes, for there are a lot of naked traders now running about who've just had their Shorts hoovered:
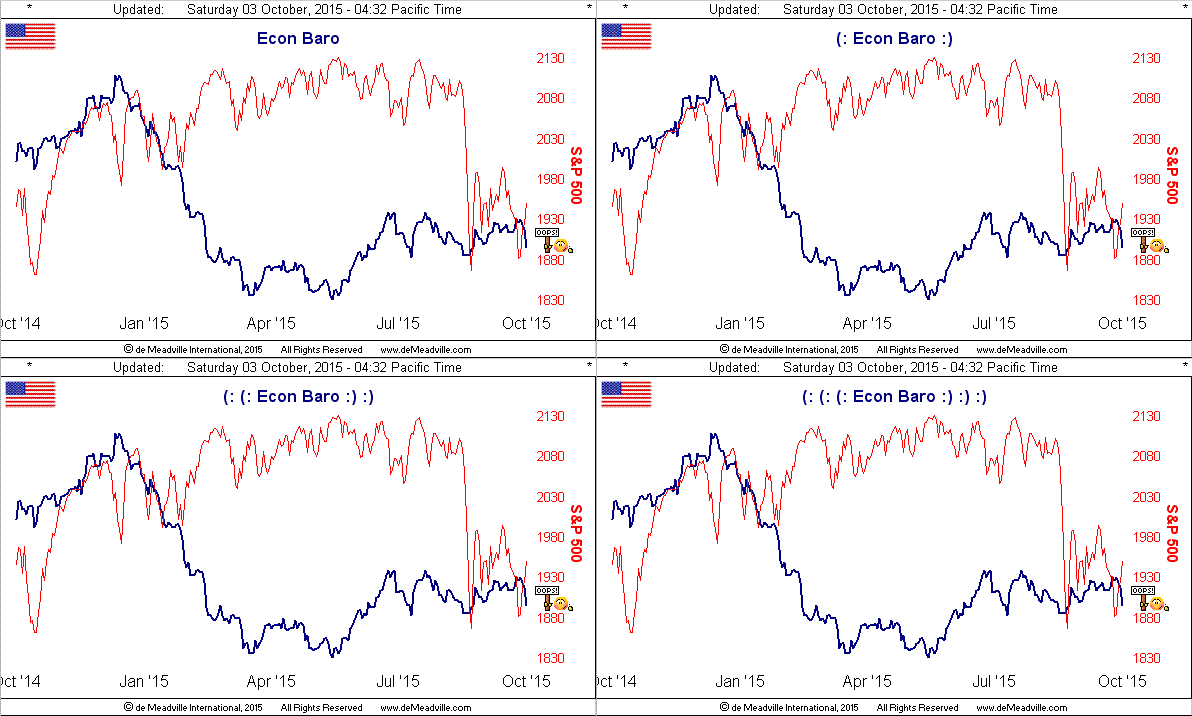
'Course the catalyst, as has been our conjecture, is an awaking cognizance to the inevitable recurrence of Quantitative Easing. 'Twill be fascinating to see the extent to which such notion begins to play into the FinMedia, let alone into the FedHeads. In September a year ago, non-farm payroll creation was 248,000; this September 'twas 142,000 (a slip of -106,000). The last time year-over-year payroll growth for the month of September slipped by at least that much was in 2008; in the Black Swan's wake come 2009, 'twas an even worse year-over-year September reading. Here's the Economic Barometer:
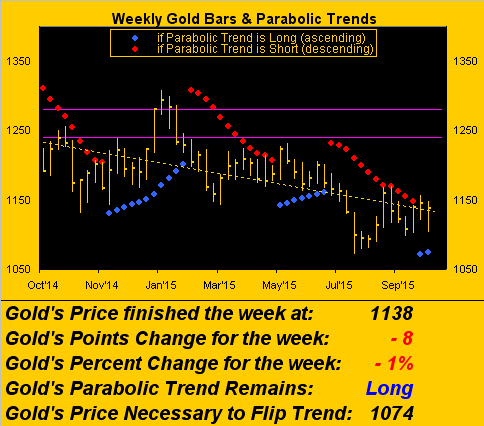
Still for Gold, its lovely lift-offs of late notwithstanding, we below see that the year-over-year dashed trendline remains down across the weekly bars. But the fresh new parabolic Long trend is intact, and 'tis worth noting as well that the last three weeks (rightmost bars) have all finished near their highs, ideally targeting at least 1170 (just above August's peak) in this trend's up stint:
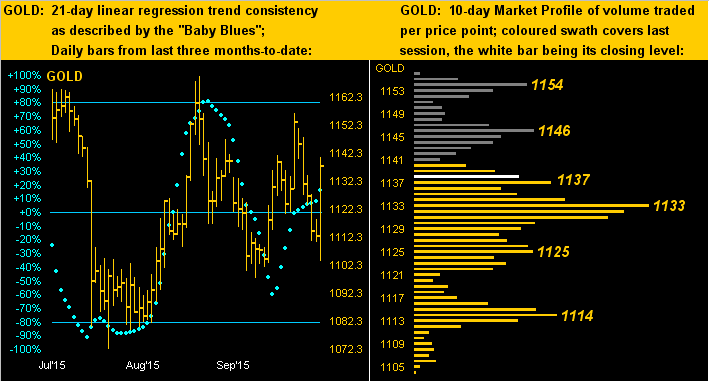
Now to our nearer-term graphics, starting with this two-panel display for Gold of its daily bars for the last three months on the left and the 10-day Market Profile on the right. The baby blue dots notched a nice lurch to the upside on yesterday's splendid spike in reinforcing the consistency of the 21-day linear regression uptrend. Trading supports show stark in the profile at 1133 and 1114, the overhead resistors as noted at 1146 and 1154:
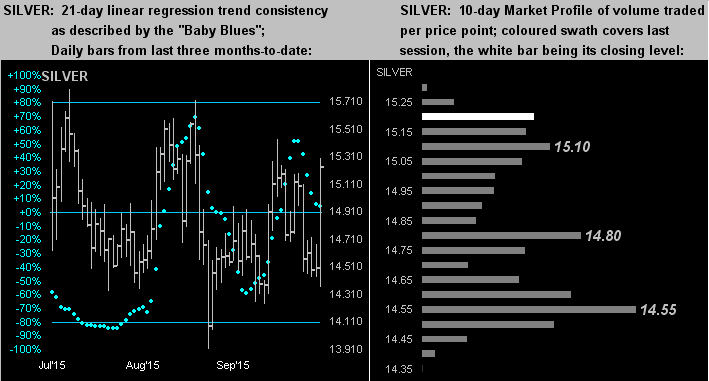
Next we've the same graphics pairing for Sister Silver, albeit her "Baby Blues" have been under some duress given her precious metal pinstripes being unraveled a bit by Cousin Copper's insistence that, in sympathy to him, she don her industrial metal jacket. Fortunately for her, as is Gold, Silver is a currency:
"But mmb, by that logic, copper's a currency too. Just look at the penny..."
Oh come now, Squire. An ounce of Silver today costs $15.24, whereas an ounce of Copper goes for a whopping 15¢. The white metal is presently valued at better than 100 times that of the red metal. What's in your piggy bank? (I know, don't tell me: a bunch of those two-tone 500 Italian Lira jobs that at the Euro conversion were worth about 25¢ apiece. Well you might as well hang onto them should the Euro fail).
Speaking of which, inflation in the EuroZone has returned to being in the red, which as repeatedly gets written, has "fueled expectations the European Central Bank will expand or extend its asset purchase program", whilst at the other end of the Chunnel, employment in the United Kingdom fell for the first time in more than two years. Best start storing your crumpets over there.
Meanwhile, by journeying through the center of the earth, we arrive in Asia to find factory layoffs on the increase toward countering the marked slowing in demand both there and abroad, whilst eyes in China turn to their People's Bank for an interest rate reduction. But India's not waiting around, their Reserve Bank Governor Raghuram "Rupee" Rajan having just overseen a 50-basis point cut in an attempt to revive investment for the private sector.
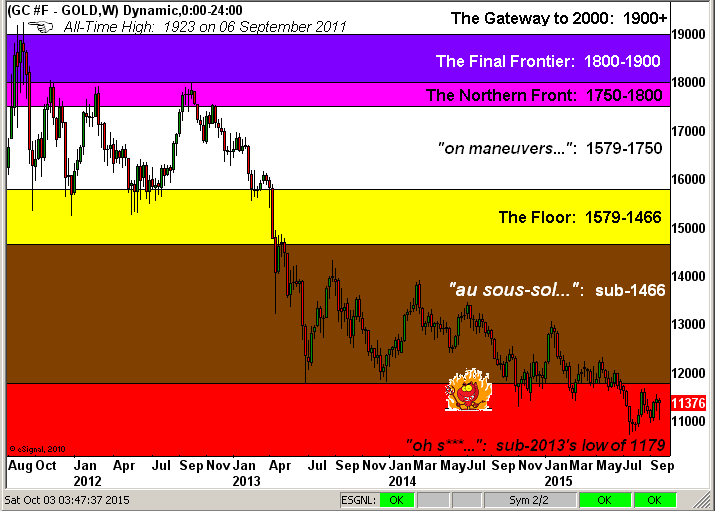
Then there's our own Federal Open Market Committee. If we thought September was a blur, the FOMC members issue their next policy statement in just three weeks' time from this Wednesday. Following the jobs jolt we received yesterday, surely the Fed shan't raise. And with time, should we indeed see the FOMC morph from rate squeeze to QE, 'twill only be marvy for Gold in at least getting out of the red as displayed here in the defined Gold Structure of weekly bars since the All-Time-High from four years (and forever) ago:
Finally, from the "One Who Tracks Goldman Sachs Dept.", did any of you notice their one-week whirl-a-around from initially citing a year-end high for the S&P of 2100 to having just revised that estimate down to 2000? Do I hear 1700? ('Tis been a long wait for those of us sittin' on the bid at 880...). But after all, given the downgrade this past week by Vetr (whatever that is) for shares of Ralph Lauren (NYSE:RL) from "strong-buy" to "buy", this may well be a very bearish sign for the stock market, indeed a bursting of the bubble for the suit set out there. We may get a strong hint of such over the next several weeks, for (drum-roll please), Q3 Earnings Season is about to begin! Hopefully your piggy bank isn't loaded with garbage, but rather with Gold!